13 New Relic Alternatives for System Monitoring
New Relic is a cloud-based monitoring solution that enables robust system tracking and deep analytics. While effective, the tool has some shortcomings, namely its high cost and a steep learning curve. Many SMBs find these issues too big to overcome, which is why a growing number of companies are starting to look at New Relic alternatives.
This article presents the best New Relic alternatives on the market. We analyze both free and premium monitoring options, so we will help you find the right tool regardless of your budget.
Top 6 New Relic Free Alternatives
The best free New Relic alternates are:
- Nagios Core.
- Netdata.
- Zabbix.
- Graphite.
- Monit.
- Munin.
While these monitoring solutions may not be as feature-rich as New Relic or other paid options, these free tools still hold value in the right use case.Learn what else your server management strategy should account for besides reliable monitoring.
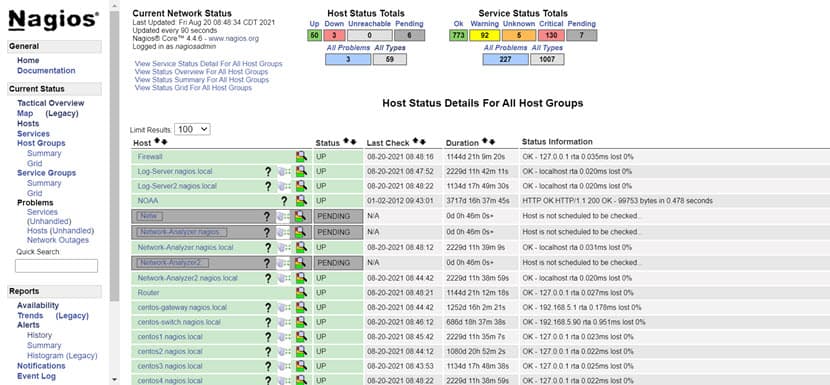
Nagios Core
Nagios Core is an open-source monitoring tool that has been on the market since 2002. The tool enables you to monitor:
- Apps.
- Networks and switches.
- Infrastructure.
Nagios Core is available for free under a GNU license and allows you to track all essential metrics, including:
- Availability.
- Response times.
- CPU loads.
- RAM usage.
- The number of logged-in users.
While Nagios Core tracks all key metrics, the tool does not show graphs. If you require charts, you will have to connect Nagios to another monitoring solution. Nagios may not be ideal for modern cloud deployments and containers.
The tool relies on a pull model where a central server connects to agents on each node, triggers a check cycle, and returns the results. Nagios also offers a paid version of its software (Nagios XI) that enables more comprehensive features (performing checks, sending notifications, processing performance data, etc.).
Main features of Nagios:
- Broad monitoring capabilities for a free tool.
- Allows you to track all essential metrics.
- Many available plugins and add-ons.
- Various alerting options.
- Users define everything in agent config files.
Netdata
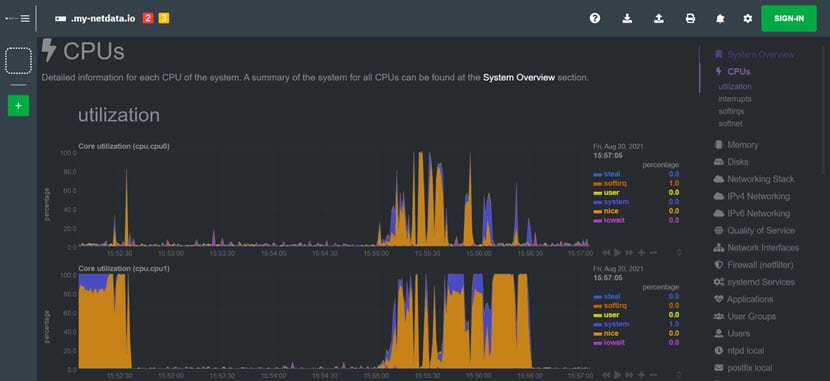
Netdata is an open-source tool that allows you to collect and analyze metrics in real-time, including:
- CPU usage.
- Disk activity.
- Bandwidth usage.
- Website visits.
- Network activity.
- Firewall activity.
- Quality of service.
Netdata allows you to store around 2,000 metrics per second and keep them for two days. For long-term storage, you can integrate the tool with a range of metrics database backends, such as:
- Prometheus.
- AWS Kinesis.
- ElasticSearch.
- InfluxDB.
- PostgreSQL.
Netdata is ideal if you work on a budget, have a small number of nodes, and are only interested in live streaming metrics.
Main features of Netdata
- In-depth app, infrastructure, and server monitoring.
- Insightful, easy-to-interpret charts.
- Per-second performance metrics for every system.
- Quick and easy setup.
- Over 100 built-in alarm types.
- A rich selection of integrations.
Zabbix
Zabbix is an open-source, PHP-based monitoring software that offers several database backend options (MySQL, PostgreSQL, TimescaleDB, and Oracle). The tool allows users to monitor:
- Networks.
- Servers.
- Apps.
- Virtual machines.
- Cloud services.
- Databases.
- Websites.
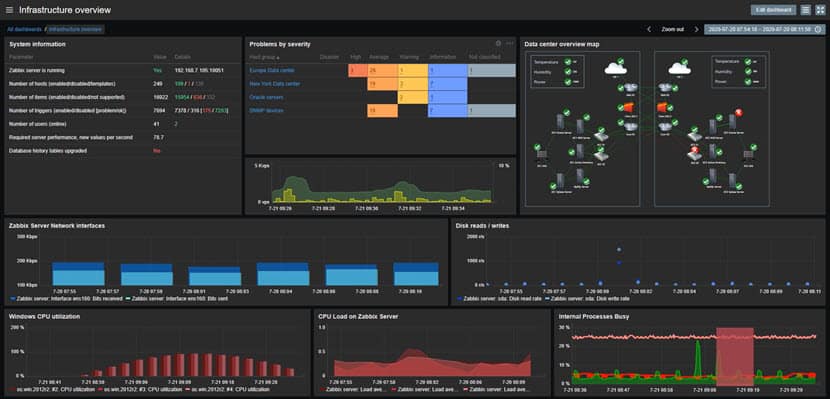
Zabbix consists of two main components, the Zabbix Server and the monitoring agent you install on each system you wish to monitor. The tool enables you to track different metrics, including:
- Network utilization.
- CPU load.
- Disk space consumption.
The Zabbix team maintains repositories and packages for Debian, Ubuntu, and CentOS. You can also choose a Docker installation if necessary.
Unlike some free New Relic alternatives, Zabbix is a deep, enterprise-grade platform capable of monitoring large-scale IT environments. As far as free tools go, this one offers the most out-of-the-box capabilities.
Main features of Zabbix
- Agents that allow you to track thousands of servers and monitor a range of metrics.
- Excellent real-time graphs.
- One-second granularity.
- Various advanced features (trend prediction, problem forecasting, event correlation, etc.).
- Also offers agent-less monitoring.
- A range of official and community plugins.
- A robust alerting system based on custom triggers and notifications.
Read about the best Docker container monitoring tools that allow you to track activities and keep your Docker-based setup in good health.
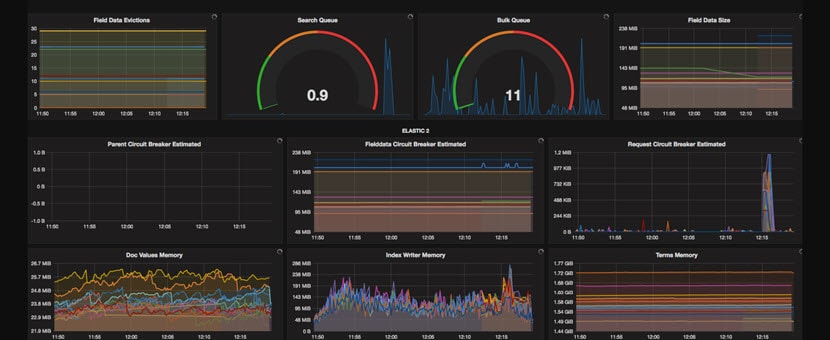
Graphite
Graphite is an open-source solution that collects, stores, and displays time-series data in real-time. The tool specializes in visualizing data but requires a third-party solution for data collection. Teams typically use Graphite to track the performance of:
- Websites.
- Apps.
- Business services.
- Servers.
While not a collection agent, Graphite offers a simple method for getting measurements into a time-series database. The tool can:
- Store numeric time-series data.
- Render graphs of data on demand.
Graphite is an excellent choice if you have simple requirements and prefer graphical monitoring.
Main features of Graphite
- Enables you to store, share, and visualize time-series data.
- Easy-to-digest, real-time graphs.
- Primarily stores and displays monitoring data (but relies on a third-party tool to get data in).
- Runs well on hardware and in the cloud.
- Numerous data integrations and third-party tools.
- Emphasizes ease-of-use.
Monit
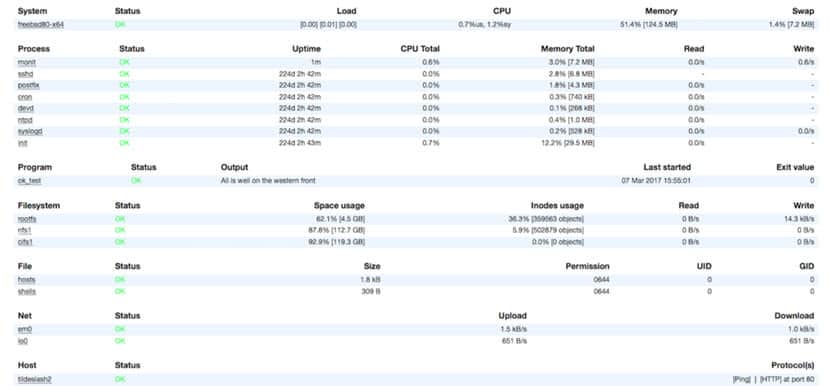
Monit is a tool that allows users to monitor all the basic UNIX system metrics (CPU, RAM, load, etc.) and individual files, down to:
- Size.
- Permissions.
- UID/GID.
Unlike most free New Relic alternatives, Monit can also perform some basic repair operations, such as:
- Restarting an Apache server.
- Responding to a DDoS attack.
- Restarting sendmail operations.
Monit can also monitor process characteristics, such as the amount of memory or CPU cycles a process uses.
Main features of Monit
- Allows you to monitor all basic system metrics and individual files.
- Tiny installation footprint (1 MB of RAM and 500 KB of disk space).
- Quick and straightforward setup process.
- Basic repair operations and error recovery.
- Excellent for monitoring daemon processes.
- Allows you to monitor localhost files, directories, and filesystems for timestamps, checksum, or size changes.
Munin
Munin is an open-source system monitoring tool that has been on the market since 2003. Written in Perl, this tool is available for:
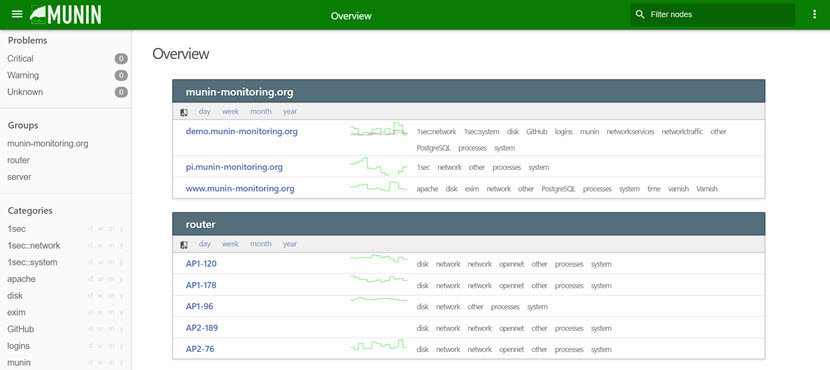
Munin excels at providing visibility into resource capacity and utilization. The tool allows users to monitor multiple servers simultaneously and recognize potential performance and capacity issues.
Main features of Munin
- Emphasizes “plug and play” capabilities.
- Simple installation and configuration processes that take less than ten minutes.
- Uses the RRDtool to create graphs you can access over a web interface.
- More than 500 available plugins allow you to monitor any service type running on your server.
- Allows you to write custom plugins in any language.
- Real-time alerts that analyze servers once every five minutes.
Unsure what OS is the best option for your web server? Our comparison of CentOs and Ubuntu weighs the two popular choices.
7 New Relic Premium Alternatives
The best paid New Relic alternatives are:
- AppDynamics.
- AppOptics.
- ManageEngine Application Manager.
- Datadog.
- Dynatrace.
- Stackify Retrace.
- Zenoss.
Unlike the free options listed above, these premium tools offer a range of sophisticated capabilities and are much more comparable to New Relic.
AppDynamics
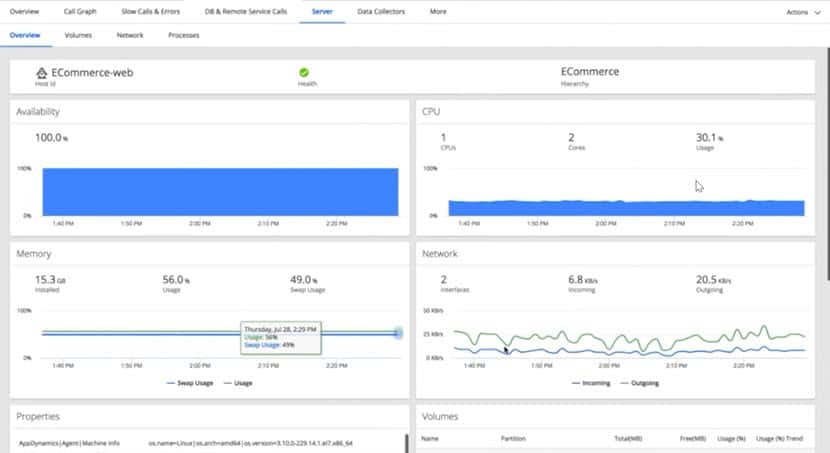
AppDynamics belongs to Cisco Systems and is an app performance management (APM) and IT operations analytics (ITOA) tool. This solution allows users to visualize the entire app infrastructure to:
- Identify bottlenecks.
- Improve overall performance.
- Gain a deeper understanding of user and app behavior.
AppDynamics allows you to monitor:
- Infrastructures.
- Applications.
- Databases.
- Business operations.
- End-user activity.
The dashboard offers two perspectives on app performance:
- The first looks at the system’s resources and delivers performance statistics for each app and its infrastructure.
- The second identifies use cases for each app and creates a typical user experience. The tool can then recognize when an app is failing to perform at an acceptable level.
AppDynamics is primarily a cloud-based service, but users can request the software for an on-premises setup in a data center. However, the tool shines the most when managing the performance and availability of cloud computing environments.
While AppDynamics does have a free edition (AppDynamics Lite), this option does not include monitoring of physical resources. Every paid plan has a 15-day free trial that allows you to run tests before committing to the tool.
Main features of AppDynamics
- Real-time insights into apps, user activity, and business performance.
- Flexible dashboards and great visualization.
- Correlates real-time metrics into business outcomes.
- An emphasis on cybersecurity.
- Application stack maps.
- Threshold-based alerting backed by machine learning.
- Deep code visibility helps diagnose and eliminate problems at the code level.
- End-to-end transaction tracing
- Dynamic baselining.
AppOptics
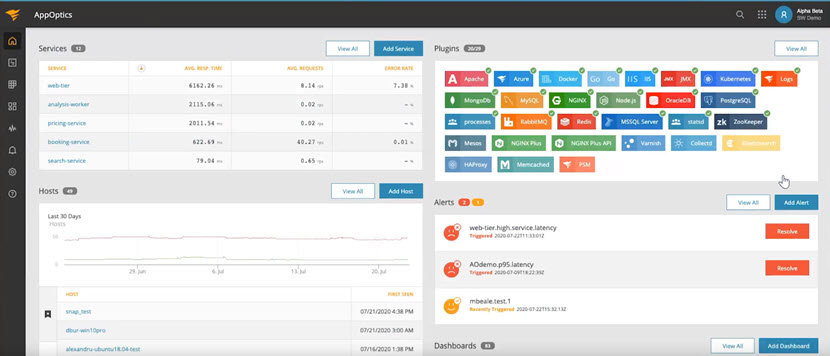
AppOptics is a tracking tool that enables you to monitor all your apps, infrastructure, and servers from a centralized platform. The tool is a part of the Solarwinds cloud monitoring suite, so the tool integrates into the Solarwinds APM and logging tools. Like New Relic, AppOptics is a SaaS system and has a wide selection of capabilities, including:
- Real-time monitoring for servers, apps, infrastructure, databases, cloud services, and networks.
- The ability to identify performance bottlenecks.
- Configurable dashboards with multi-dimensional tags.
- Alerting systems with thresholds based on trigger conditions and aggregations.
AppOptics is available in two plan levels:
- The lower tier provides infrastructure monitoring for servers, networks, and cloud resources.
- The higher plan adds advanced app performance monitoring (this plan is the exact equivalent to New Relic’s features).
The cheaper tier does offer some basic app monitoring, however, such as monitoring Docker or Kubernetes containers.
AppOptics has a 14-day trial during which you can test the software for free. If you decide to extend beyond the trial period, AppOptics subscription charges a monthly rate per host.
Main features of AppOptics
- Deep monitoring that includes tracking of CPU, memory, disk utilization, and interface I/O.
- High levels of customization.
- Highly scalable and cost-effective infrastructure monitoring.
- A robust alerting system based on custom thresholds.
- Deep and insightful analytics.
- More than 150 options for integrations and plugins.
- Quick root cause analysis in case of a performance drop.
- Deep code analysis that makes the tool ideal for in-house apps.
ManageEngine Application Manager
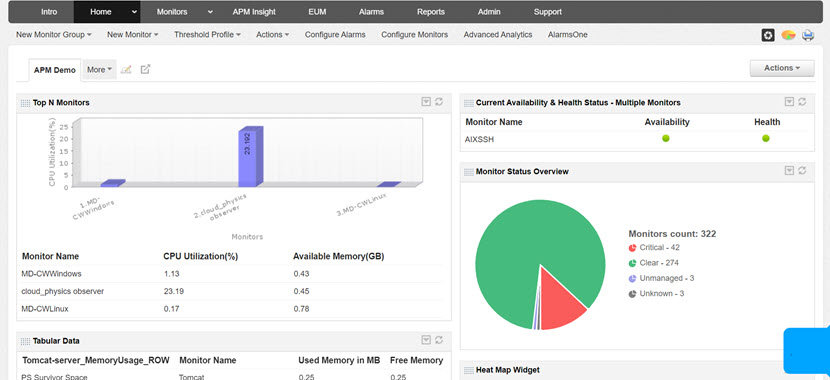
ManageEngine Applications Manager is a monitoring tool that offers deep visibility into app and infrastructure performance. This tool is a popular monitoring solution choice for DevOps teams as it can:
- Correlate performance changes with code commits and builds.
- Analyze the code for web apps.
- Monitor API performance.
- Trace the execution of microservices.
The tool has a broad scope and allows users to monitor:
- Web apps.
- Multi-cloud setups.
- Servers.
- Databases.
- Containers.
- ERPs (SAP, Oracle EBS, Microsoft Dynamics CRM & AX, and Siebel CRM).
- Middleware environments.
- Websites and internet services (HTTPS, DNS server, FTP server, SSL certificates, etc.).
ManageEngine offers extensive processes for monitoring and managing web and mobile apps. Unlike New Relic that is a cloud-based service, ManageEngine requires on-premise installation. The tool is available for Windows and Linux servers. The tool is available in two editions (Professional for up to 500 apps and Enterprise for more), both of which have a 30-day free trial.
Main features of ManageEngine
- Supports monitoring of over 150 app and infrastructure elements.
- Deep monitoring capabilities for web services and mobile apps.
- Adaptive thresholds and dynamic baselines.
- Automated actions for quick troubleshooting.
- Robust performance forecasting backed by machine learning.
- A powerful, customizable alerting mechanism with both manual and automatic capabilities.
- Automated discovery processes for new servers and apps.
Read about the current DevOps trends driving the industry and ensure your team keeps up with competitors.
Datadog
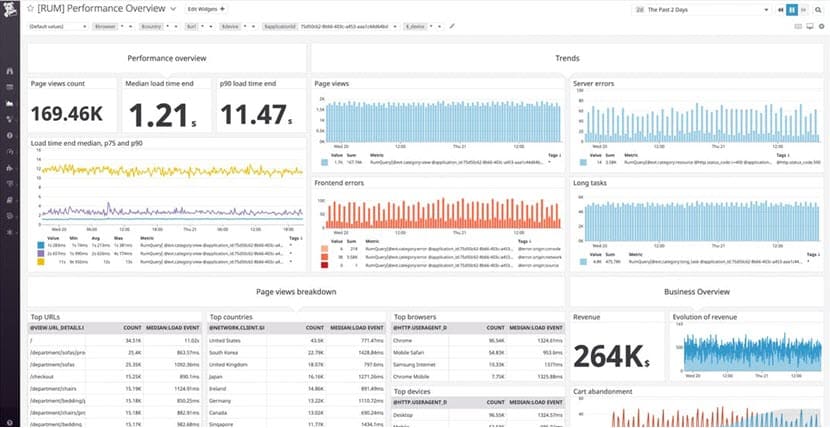
Datadog offers a set of tools for monitoring cloud-based apps that allow you to combine data from servers, databases, and containers into a single platform. As a result, the stack becomes more transparent and easier to follow. Datadog can break an app into individual services (over 450) and enable a highly granular look at the system.
This end-to-end visibility is possible by collecting events, logs, and metrics from more than 400 technologies. The toolset also provides users with:
- Application performance management.
- Log management.
- Cloud management.
- Real user monitoring.
- Incident management.
- Network and synthetic monitoring.
Due to the tool’s rich capabilities, Datadog is an excellent monitoring solution for apps running in a hybrid cloud architecture. However, all the customizability and flexibility make the tool more complex to use then most New Relic alternatives.
Another common problem with Datadog is that the tool can get expensive very quickly. Server monitoring pricing ranges from $15-27/server/month depending on features. You can get the tool’s free version, but this option only supports up to 5 hosts and only one day of data retention. There is also no alerting, custom metrics, or support for containers.
Main features of Datadog
- Offers a holistic view of the entire infrastructure.
- More than 450 integrations covering every tech stack.
- An open-source monitoring agent that allows you to write custom plugins.
- A powerful alerting system based on anomalies, events, forecast behavior, outlier detection, and process monitoring.
- Excellent out-of-the-box dashboards.
- Log management with rich and correlated data speed up troubleshooting.
- Various graphical representations (charts, graphs, and models).
- A system dependency map that helps with root cause analysis.
Dynatrace
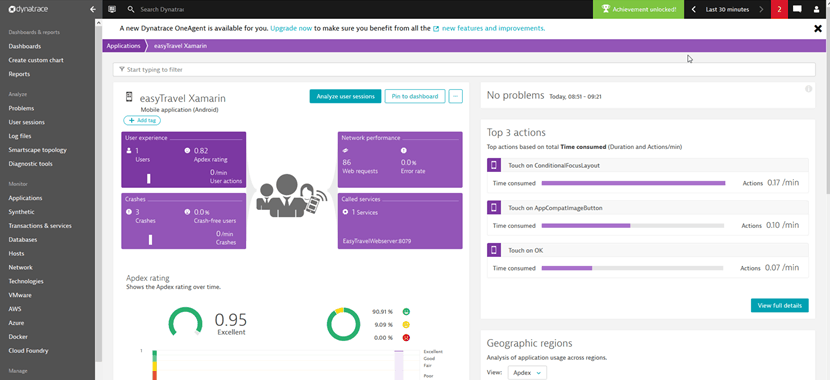
The Dynatrace is an AI-based monitoring tool that automatically ensures typical system performance. Automation is at the core of Dynatrace, and users have access to many automation options, so there is no need for manual configuration or scripting. Like New Relic, Dynatrace automatically maps the dependencies for all entities, both up and down the stack. The tool also maps relationships between processes, hosts, and services.
Dynatrace is an excellent fit for teams hoping to gain software intelligence for the enterprise cloud. The tool simplifies cloud management and accelerates digital transformation. This tool has some problems, though. The most significant issues are the limited integration options, odd alerting mechanisms, and complex pricing schemes.
Main features of Dynatrace
- Gives complete visibility into public, private, and hybrid cloud.
- Offers full-stack monitoring that covers the entire infrastructure, from logs to APM to code-level analytics.
- Heavily emphasizes automation, so the correct use of the tool should not rely on manual interventions.
- Can visualize app dependencies and infrastructure.
- Zero-touch configurations make setups quick and easy.
- Excellent at quickly identifying the root cause of problems and running auto-remediation measures.
- Includes AIOps capabilities.
Stackify Retrace
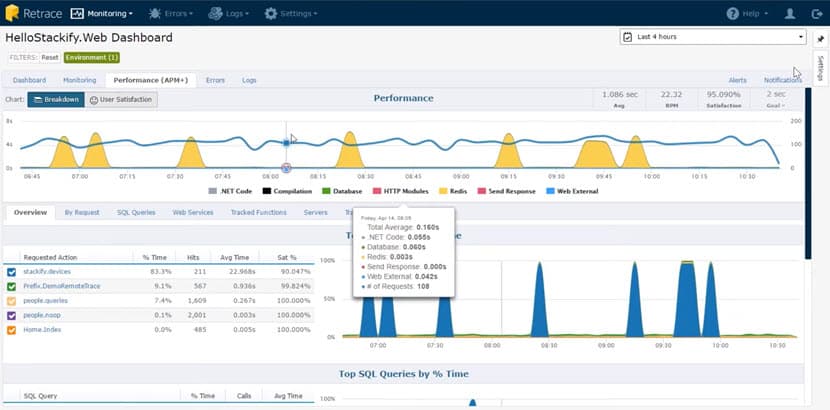
Stackify Retrace is a SaaS-based monitoring tool that maintains the performance of cloud-based applications. The solution also specializes in infrastructure monitoring.
Stackify Retrace is an ideal option for developers as the tool combines app logging with code profiling. Even lightweight code profiling is enough to track and monitor app metrics. Retrace also helps quickly identify bottlenecks by:
- Monitoring user satisfaction.
- Tracking deployments.
- Identifying slow dependencies.
While it offers similar abilities as New Relic, Retrace is considerably cheaper.
Main features of Stackify Retrace
- Monitoring capabilities tailored towards developers.
- A rich toolchain removes the need to integrate with other monitoring solutions.
- Identifies and helps fix bottlenecks in the app’s performance.
- Helps identify performance issues immediately after deployment to a production environment, ensuring quality across the software development life cycle (SDLC).
- Simple dashboards and clean UI.
- A code tracing capability that is easier to use than the New Relic one.
- Centralized log management that aggregates logs across all apps and servers.
Our article about server monitoring tools presents and analyzes the market’s best options for keeping servers safe and in good shape.
Zenoss
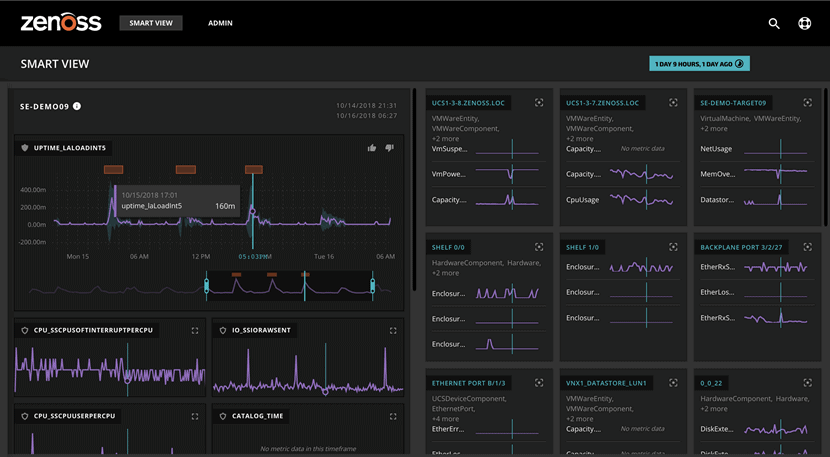
Zenoss is a popular performance management tool that identifies and fixes issues in hybrid IT environments. This SaaS-based platform gathers, analyzes, and presents data in the form of practical, actionable business intelligence. Zenoss allows you to monitor:
- Cloud setups.
- Storages.
- Infrastructure.
- Virtualization environments.
- Networks.
- Servers.
- On-prem apps.
- IT services.
Zenoss streams and normalizes all machine data, adding valuable context to events and preventing service disruptions in complex, modern IT environments.
The main features of Zenoss
- Continuously monitors critical apps to ensure top performance.
- Total visibility of the IT architecture.
- Dynamic dashboards that give a bird’s eye view of the app and its performance.
- Enables you to use events to drive automated monitoring policies and limit manual interventions.
- Excels at predicting and removing outages for hybrid IT environments.
- Easy rollbacks of configuration changes.
- Built-in backup and restore procedures.
- A vendor-agnostic platform with multi-platform support.
Take Your Pick from New Relic Alternatives
While feature-rich and powerful, New Relic is expensive and not always an ideal fit for your monitoring needs. Depending on your use case and budget, one of the New Relic alternatives listed above might be a better choice, so use the info in this article to find an ideal monitoring solution.