Nagios Tutorial: Continuous Monitoring with Nagios Core and XI
Nagios is a popular monitoring tool many DevOps teams use to ensure thorough and efficient tracking of systems, devices, apps, and services. However, the tool does have a steep learning curve, so setting up and starting to use Nagios can be tricky without prior experience or a good tutorial.
This article gives an overview of Nagios' capabilities and provides an ideal starting point for newcomers to the tool.
Read on to learn about Nagios' essential features, benefits, and architecture, and discover how companies use the tool to ensure continuous monitoring of IT environments.
What Is Continuous Monitoring?
Continuous monitoring is a process of constant detecting, reporting, and responding to risks and events within an IT system. This process is a vital DevOps security practice and has multiple goals:
- Provide real-time insight into system performance.
- Offer feedback on the overall health and security of IT infrastructure.
- Enhance visibility across IT operations and the DevOps pipeline.
- Identify the cause of incidents and apply mitigation before the problem results in downtime or a data breach.
The need for continuous tracking comes from the issues of manual monitoring as traditional tracking is too prone to:
- Slowing down deployments in CI/CD pipelines.
- Causing performance issues in production.
- Lengthy and challenging root-cause analysis.
The ability to quickly detect, report, and respond to threats is vital to a company's overall cybersecurity. Continuous monitoring is also a standard practice within SecOps teams as reliable, real-time insights throughout environments improve:
- Threat intelligence.
- Root cause analysis.
- Incident responses.
- Post-incident forensics.
Other popular terms for continuous monitoring are ConMon and Continuous Control Monitoring (CCM).
Why Is ConMon Important?
Continuous monitoring is a vital aspect of modern cybersecurity. A sound ConMon solution allows a security team to:
- Quickly detect system issues (network errors, low memory, port failures, system crashes, unreachable servers, etc.).
- Resolve problems before they impact users or business productivity.
- Identify security and compliance risks within the infrastructure.
- Lower the risk of cyberattacks with a timely alert system and automatic incident responses.
- Precisely identify the root cause of an issue.
- Maintain high levels of system uptime and availability.
- Use precise historical analysis to plan infrastructure upgrades.
- Track user experience and behavior following an app update (a capability vital for multiple teams, including development, QA, and customer service).
If you are looking for a ConMon solution, our articles on cloud monitoring and server monitoring tools can help you find the right software.
What Is Nagios?
Nagios is an open-source app for monitoring systems, networks, and IT infrastructure. The tool allows users to track the state and performance of:
- Hardware (routers, switches, firewalls, dedicated servers, workstations, printers, etc.).
- Networks.
- Apps.
- Services.
- Business processes.
- Operating systems (Windows, Linux, Unix, and OSX).
Nagios runs periodic checks on critical thresholds and metrics to monitor for system changes and potential problems. If the software runs into an issue, the tool notifies admins and can also run automatic scripts to contain and remedy the situation.
You can use Nagios to monitor:
- Memory and disk usage.
- CPU loads.
- The number of running processes.
- Log files.
- System availability.
- Response times.
- URL and content monitoring metrics.
- Services and network protocols (SMTP, POP3, HTTP, etc.).
The tool is available in two main variants:
- Nagios Core: The free version of the software that allows users to track all essential metrics.
- Nagios XI: A paid, extended version of Core that provides advanced components and tools for monitoring.
This software is a common tool of choice in DevOps circles due to the solution's scalability, efficiency, and flexibility.
Our article on the best DevOps tools presents the top options on the market and helps put together an ideal DevOps toolchain.
Why Do We Need Nagios?
As with all robust ConMon tools, Nagios eliminates the need for manual monitoring. The team gets to focus on more impactful tasks than identifying and fixing infrastructure errors. Nagios also standardizes and centralizes monitoring across all environments, devices, and systems.
Other reasons why DevOps and SecOps teams often see Nagios as their go-to continuous monitoring tool are:
- Even the free version of Nagios allows users to monitor all mission-critical components and metrics.
- The tool's high scalability enables a team to track thousands of devices and 100,000+ node environments.
- The software can quickly detect all types of network/server issues and effectively identify root causes.
- Nagios excels at monitoring database servers (SQL Server, Oracle, MySQL, Postgres, etc.).
If you are interested in a database server but are unsure how much it will set you back, our article on database server pricing can help estimate the cost of your future setup.
Benefits of Nagios
Here are the main benefits of using Nagios for continuous monitoring:
- Better system availability and performance.
- The tool removes the need for periodic testing.
- Fast detection of outages, website defacement, and hijacking attempts.
- Capacity planning helps plan future IT upgrades.
- As the tool is open source, skilled teams can adjust the software to fit business needs.
- Nagios has the backing of a large active community that constantly works on new add-ons.
- Nagios plugins, which are free to download and develop, provide high levels of flexibility.
- The solution's alerting and response systems ensure high levels of security.
Our article on network security tools presents additional tools you can use alongside Nagios to ensure safe and transparent network operations.
Nagios Features
Here are the main features of the Nagios monitoring tool:
- Allows teams to set custom thresholds for perimeters and metrics. If the system pushes past the set limit, Nagios can send alerts via SMS, e-mail, or voice call.
- Support for both agent-based and agentless configurations. Nagios Remote Plugin Executor (NRPE) agent allows you to run remote scripts and plugins.
- A highly customizable UI with multi-tenant capabilities that allow you to assign custom visibility to each user.
- Multiple APIs enable simple integration with both in-house and third-party apps.
- An archive of configuration snapshots enables you to revert to a previous working setup if the system runs into a serious problem.
- Step-by-step monitoring wizards that help set up the tool quickly and easily.
- Historical performance and capacity planning help project future usage and plan for IT upgrades before critical systems become overloaded.
- A robust log management system.
- Parallel processing that ensures fast detection of outages and hardware issues.
- Allows you to set up monitoring on machines across multiple locations. All devices then send outputs to the central Nagios server.
- Uses topology to determine dependencies.
- Allows users to define the hierarchy of networks using parent hosts.
Nagios Architecture
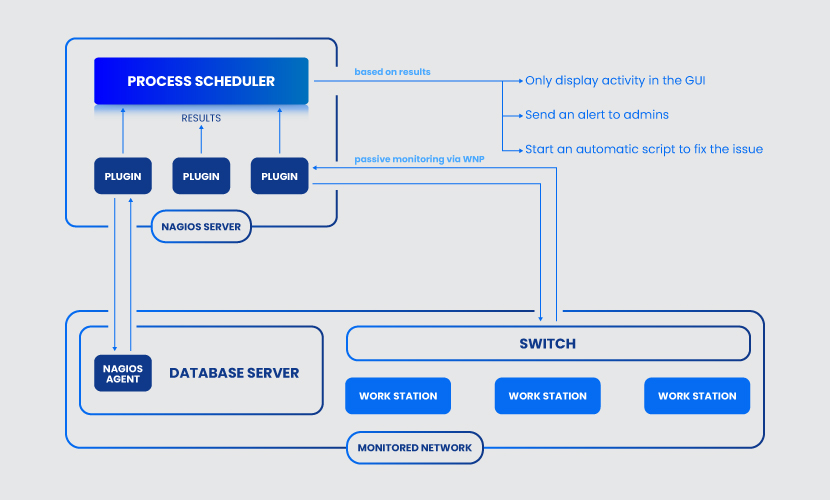
Nagios runs on a host server (usually as a daemon) and the tool's operations rely on a server-agent architecture. You set up an agent at the network element that requires monitoring, and the agent communicates with the Nagios server. The tool retrieves metrics via the agent and makes decisions based on events and set thresholds.
Another way Nagios can communicate with systems is through native protocols, such as SNMP or WMI. Depending on the setup, both agent and protocol-based monitoring can either be:
- Active: The server reaches out to elements such as switches or servers and inquires about their status.
- Passive: The monitored system sends info to the server either regularly or in case of an incident.
Nagios architecture has three main components:
- Plugins: Configurable add-ons that run on the Nagios server and communicate with local and remote hosts that require monitoring.
- The process scheduler: The scheduler checks plugins at regular intervals and performs actions based on results (such as alerting the staff or initiating an automatic script to remedy the problem).
- Graphical user interface (GUI): This is the user interface of the Nagios system through which users interact with the tool and view monitoring data.
While you can use the web-based GUI to interact with the tool, teams can also work in the command-line interface (CLI).
Nagios Plugins
Plugins are stand-alone add-ons and extensions that allow users to:
- Define targets and parameters on monitored systems.
- Check the state of a host or service.
Plugins are either compiled binaries (written in C, C++, etc.) or executable scripts (Shell, Perl, PHP, etc.) users run from a command line. Plugins run on the Nagios server and enable users to monitor both remote and local hosts via agents or local protocols. Nagios uses the results generated by a plugin to determine:
- The status of the host.
- If the event requires an immediate alert or a simple log on the GUI.
- Whether to run an automatic script for fixing the issue.
Nagios plugins come in three types:
- Official plugins: Nagios develops and maintains around 50 official add-ons.
- Community plugins: There are over 3,000 available third-party plugins developed by community members.
- Custom add-ons: If your team has the right skills, the open-source nature of the tool allows you to create custom plugins.
All plugins follow a status code. The table below explains the default exit code statuses and their descriptions:
| EXIT CODE | STATUS | DESCRIPTION |
|---|---|---|
| 0 | OK | The system is working fine |
| 1 | WARNING | The system continues to operate but requires attention |
| 2 | CRITICAL | The system is not working correctly |
| 3 | UNKNOWN | The plugin cannot assess the status of the host or service |
Nagios GUI
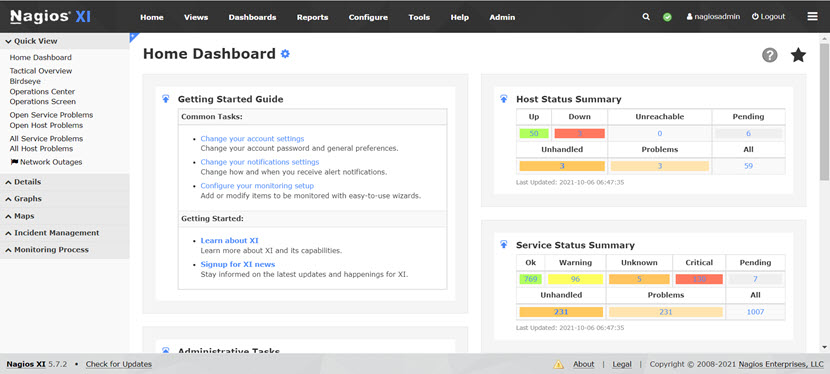
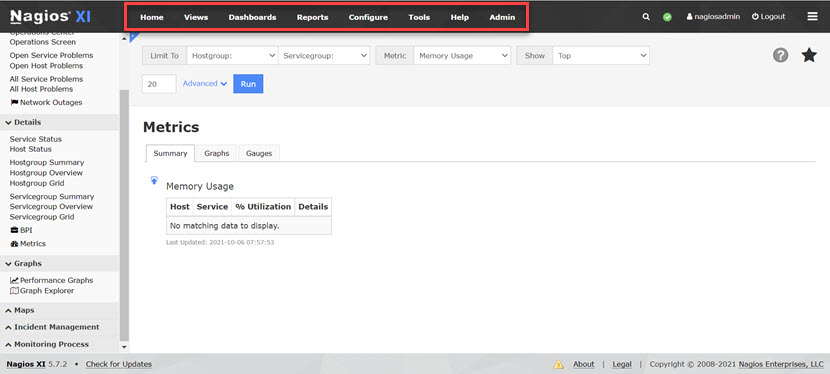
The graphical user interface (GUI) offers an overview of all the processes going on within Nagios. The Nagios XI GUI provides viewing of the most critical monitoring data and has six submenus:
- Quick view: A customizable interface that contains different Dashlets users can add, delete, and manipulate to suit their needs. Quick view is where you find the Tactical Overview, an overall summary of all hosts and services you are currently monitoring.
- Details: This menu displays detailed summaries of all hosts and services. The Details tab shows all statistics, commands, and services running for each host.
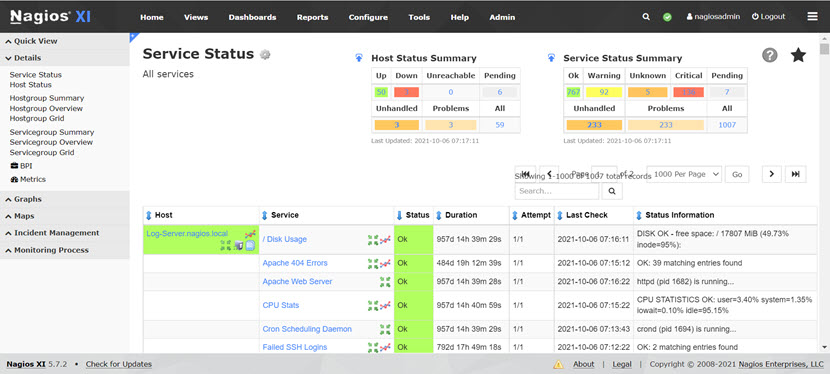
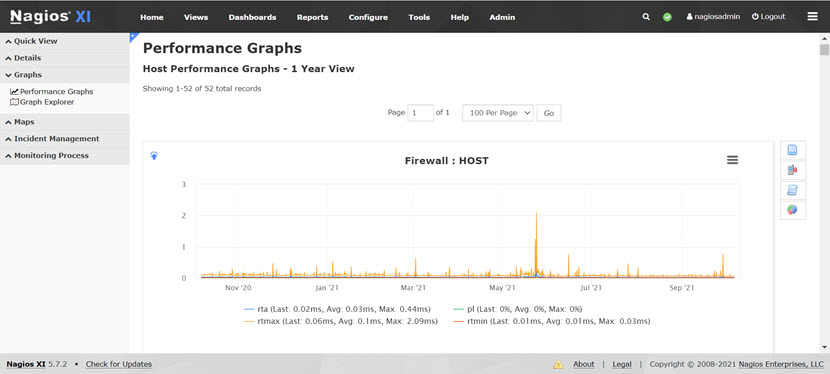
- Graphs: This menu shows a series of scalable performance graphs for all monitored services for each host.
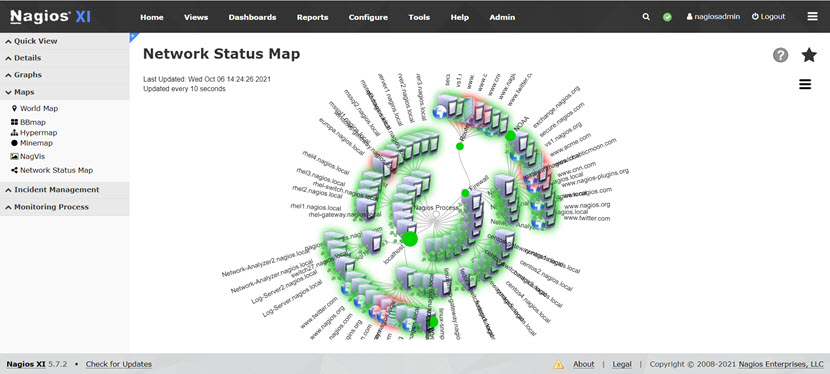
- Maps: A graphical status map of all hosts and parent-child relationships. You can view the map as a balloon or treemap (or install a custom add-on for some other mapping option).
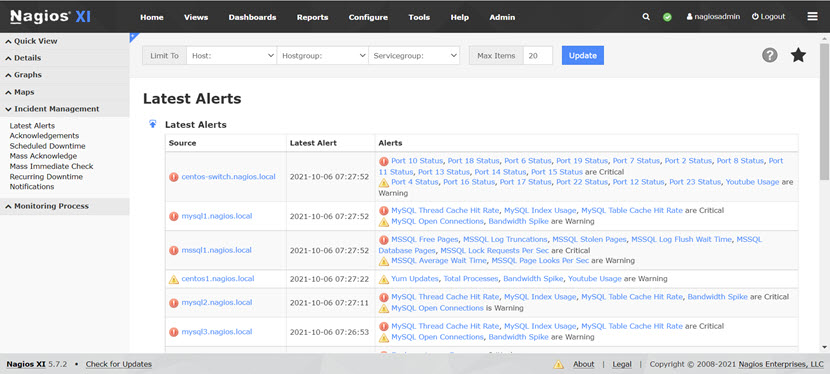
- Incident management: This menu summarizes all current notifications and alerts for services and hosts.
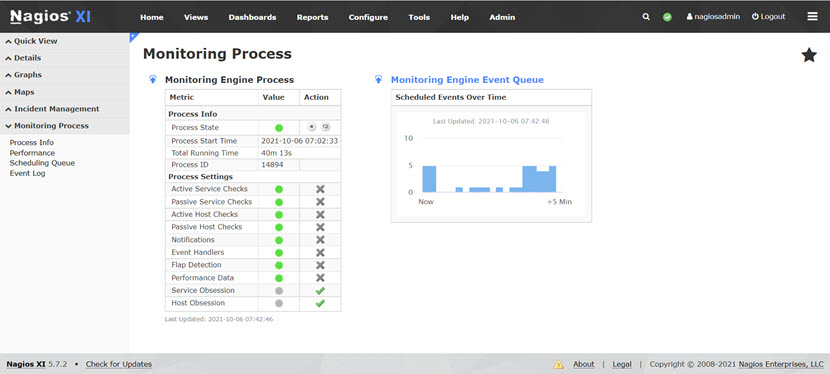
- Monitoring process: This menu displays data about the tool's internal operations.
In the top menu, you will find:
- Views: Quick access to a set of views unique to each user. Useful for network admins who wish to display data on wall monitors in a network operations center (NOC).
- Dashboards: Customizable dashboards that display essential, relevant data specific to individual Nagios users.
- Reports: This menu provides an easy way to generate statistics and graphical reports for hosts and services.
- Configure: The Configure menu allows you to set up new monitoring processes with the help of the Monitoring Wizard.
- Tools: Utilities that you can quickly access from Nagios using a web browser.
- Help: Direct access to the Nagios support resources and team.
Nagios Core Installation
The step-by-step guide below shows how to install Nagios Core on Ubuntu 20.04.
Step 1: Check for System Updates
1. You should first check the web for the latest available packages:
$ sudo apt update2. Next, upgrade the system packages to the latest versions:
$ sudo apt upgradeStep 2: Install Prerequisite Packages
After updating the system, you need to install the packages required to run Core. Enter the following code into the command line:
$ sudo apt install wget unzip vim curl gcc openssl build-essential libgd-dev libssl-dev libapache2-mod-php php-gd php apache2Step 3: Download Nagios Core
Download Nagios Core. To do so, browse to the official Git repository and select the latest release. Alternatively, you can download the tool from the official website. At the time of writing this article, the latest version of Nagios is 4.4.6, so we use the following command to extract the tool:
$ export VER="4.4.6"Now, use the curl command:
$ curl -SL https://github.com/NagiosEnterprises/nagioscore/releases/download/nagios-$VER/nagios-$VER.tar.gz | tar -xzf -This command downloads a directory called nagios-4.4.6 and adds it to your current working directory.
Step 4: Install Nagios
We now need to install Core by compiling from the source.
1. Navigate into the Nagios directory:
$ cd nagios-4.4.62. Run the configure script:
$ ./configure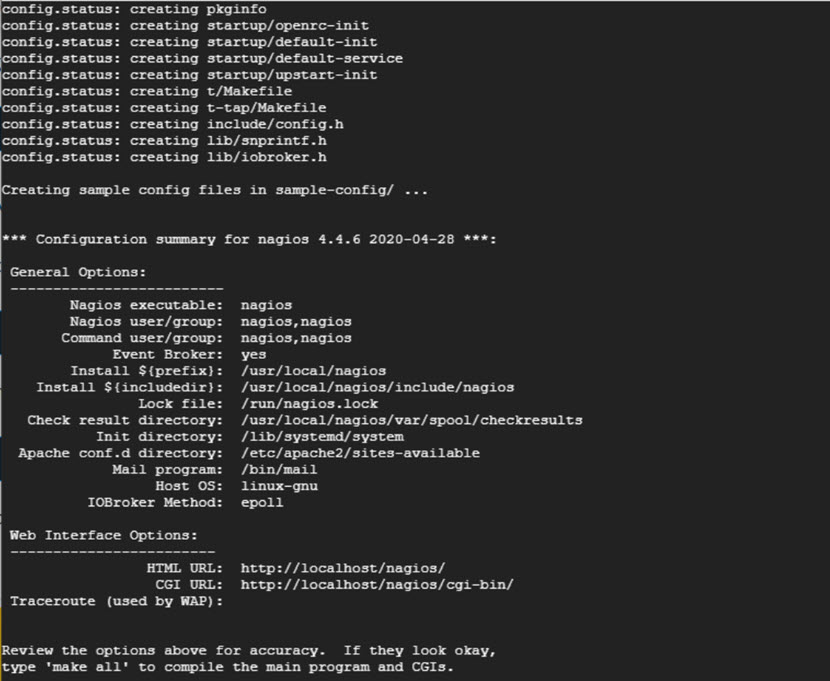
3. Run the make all command to compile the program alongside the CGIs:
$ sudo make all4. Next, we need to create group users:
$ sudo make install-groups-users
$ sudo usermod -a -G nagios www-data
5. Now install Nagios Core on your Ubuntu system:
$ sudo make install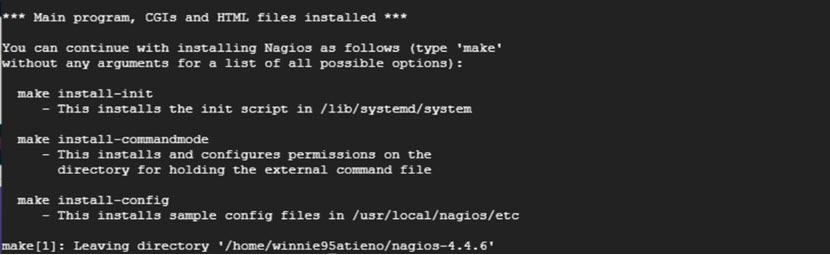
6. As you can see, some additional instructions appear on the screen. Run the following command to install the init script in the /lib/systemd/system path:
$ sudo make install-init7. Next, install and configure permissions on the directory:
$ sudo make install-commandmode8. Finally, install sample config files in /usr/local/nagios/etc/:
$ sudo make install-configStep 5: Set up Apache and Nagios UI
1. You need to enable the Apache module required for the Nagios web interface, so run the following command:
$ sudo make install-webconf
$ sudo a2enmod rewrite cgi
$ sudo systemctl restart apache2
2. Type in the following command for the classic Nagios monitoring theme:
$ sudo make install-classicuiStep 6: Create the First Nagios User
We now need to create a user that can log in to Nagios. The following command creates a user called nagadmin:
$ sudo htpasswd -c /usr/local/nagios/etc/htpasswd.users nagadminYou need to provide a password for the user and confirm it (by default, passwords are stored in /usr/local/nagios/etc/htpasswd.users).
Step 7: Install Nagios Plugins
Look at the latest available plugins at the official repository (at the time of writing this article, the newest released version is 2.3.3).
1. To download plugins, type the following command:
$ VER="2.3.3"
$ curl -SL https://github.com/nagios-plugins/nagios-plugins/releases/download/release-$VER/nagios-plugins-$VER.tar.gz | tar -xzf -
2. This command creates a new directory (nagios-plugins-2.3.3) in your current working directory. To install plugins, you first need to navigate to the new directory:
$ cd nagios-plugins-2.3.33. Now compile the plugins from source:
$ ./configure --with-nagios-user=nagios --with-nagios-group=nagios
$ sudo make install
4. To make sure all configurations are in order, run the following command:
$ sudo /usr/local/nagios/bin/nagios -v /usr/local/nagios/etc/nagios.cfgStep 8: Start the Nagios Daemon
1. The last step is to start the Nagios service, which we achieve with the following command:
$ sudo systemctl enable --now nagios2. To make sure the tool is running, use the following command:
$ sudo systemctl status nagios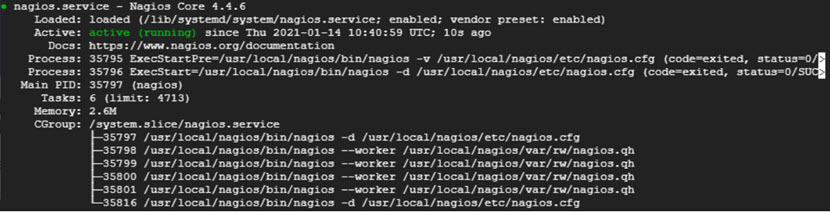
3. You can now access the tool by opening your browser and navigating to the http://server-IP/nagios URL.
4. Once prompted, type in the credentials defined in step 6 to sign in and you are ready to start monitoring.
Disadvantages of Using Nagios
While rich with capabilities, Nagios is not a perfect tool. Here are the main disadvantages of using Nagios:
- The interface can overwhelm beginners with high amounts of data.
- While Nagios Core is free, many features (such as wizards, in-depth graphs, and interactive dashboards) are only available if you buy Nagios XI.
- Some configuration files can be challenging to configure.
- The solution cannot monitor network throughput.
- The tool treats every device (servers, routers, switches, etc.) as a host.
- The tool requires a lot of customization and tuning to make it suitable for a particular environment.
Excellent Monitoring Capabilities, Even With the Free Version of the Tool
Nagios is a sound option for any business looking for reliable system monitoring. If your team never used the tool before, consider setting up Nagios Core for free and testing the tool's capabilities first-hand. After a few weeks with Core, you will know whether the team requires XI or not. Either way, your IT monitoring will see massive improvements.